Lisa Mais* ,
Peter Hirsch*
,
Claire Managan
,
Ramya Kandarpa,
Josef Lorenz Rumberger
,
Annika Reinke
,
Lena Maier-Hein
,
Gudrun Ihrke
,
Dagmar Kainmueller
* shared first authors
[Project] [Paper] [Data] [Documentation] [Metrics] [Leaderboard] [BibTeX] [Changelog]
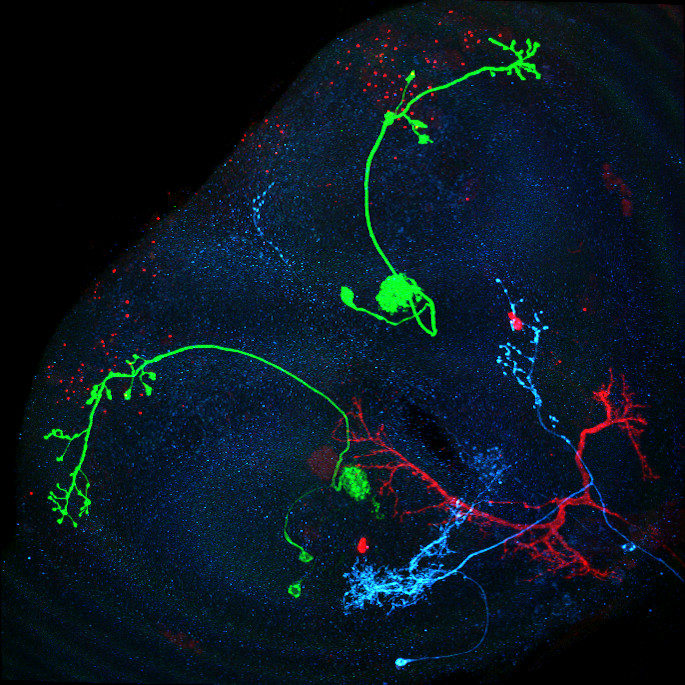
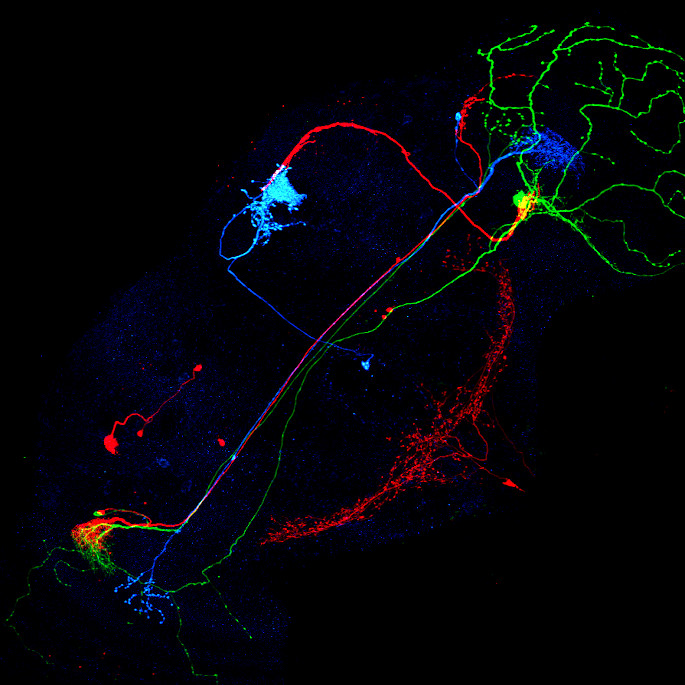
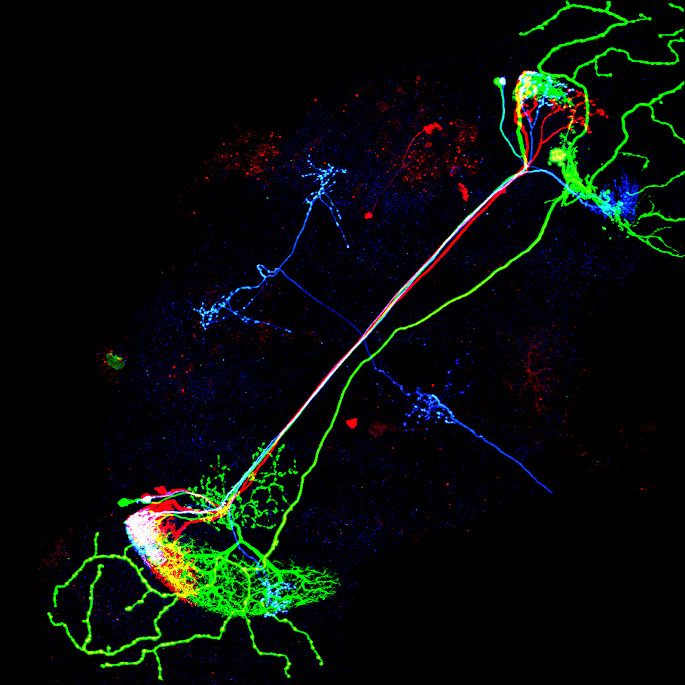
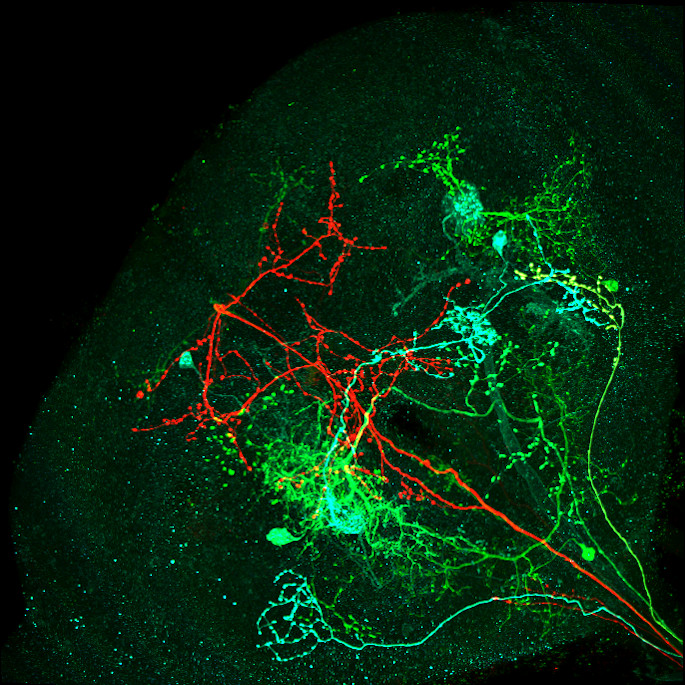
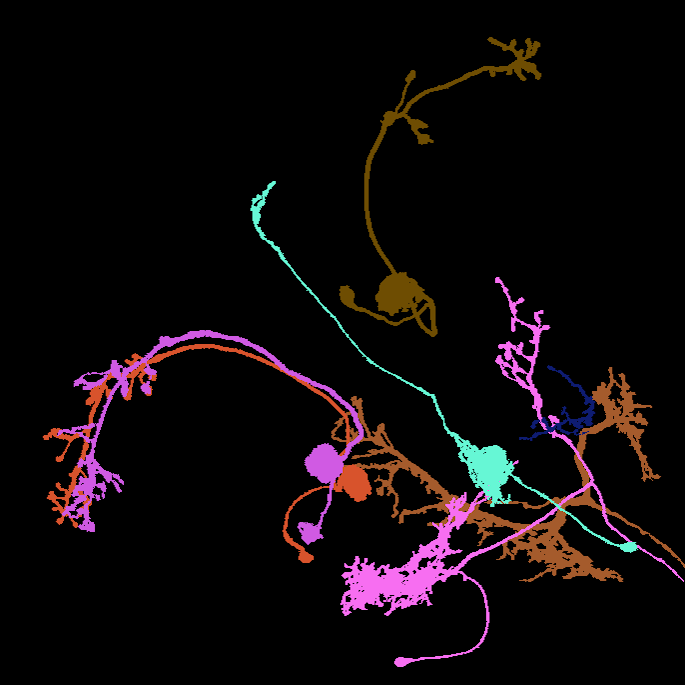
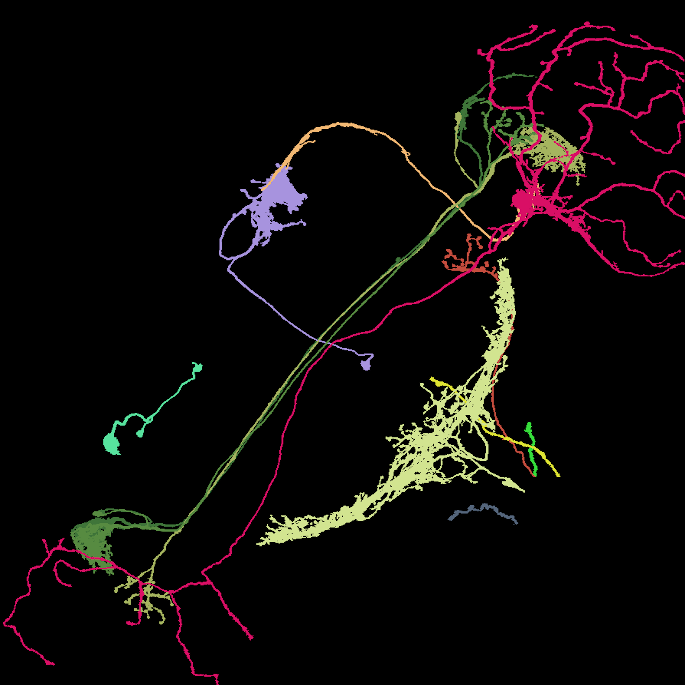
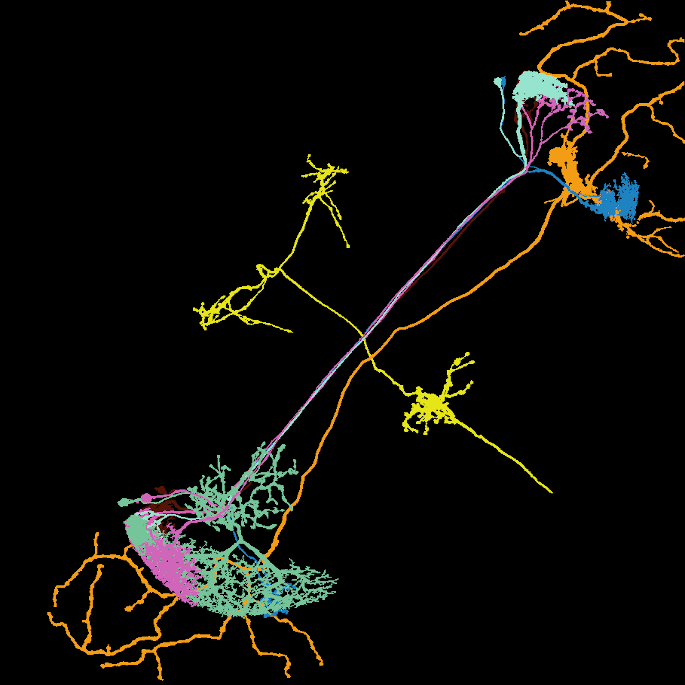
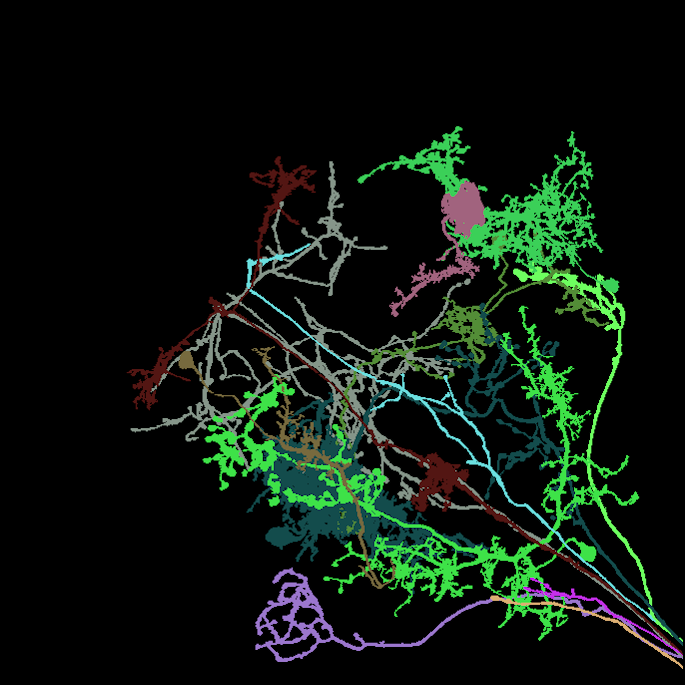
Image: Maximum intensity projection of four example 3d light microscopy images in the top row, their respective ground truth segmentation in the bottom row. The images have an average size of ~400x700x700 pixels, an isotropic resolution of 0.44μm and three color channels.
Summary
- A new dataset for neuron instance segmentation in 3d multicolor light microscopy data of fruit fly brains
- 30 completely labeled (segmented) images
- 71 partly labeled images
- altogether comprising ∼600 expert-labeled neuron instances (labeling a single neuron takes between 30-60 min on average, yet a difficult one can take up to 4 hours)
- To the best of our knowledge, the first real-world benchmark dataset for instance segmentation of long thin filamentous objects
- A set of metrics and a novel ranking score for respective meaningful method benchmarking
- An evaluation of three baseline methods in terms of the above metrics and score
Announcements
- April 2024: The data is now publicly available.
- February 2024: The paper got accepted at CVPR 2024!
- November 2023: The paper is currently under review.
Abstract
Instance segmentation of neurons in volumetric light microscopy images of nervous systems enables groundbreaking research in neuroscience by facilitating joint functional and morphological analyses of neural circuits at cellular resolution. Yet said multi-neuron light microscopy data exhibits extremely challenging properties for the task of instance segmentation: Individual neurons have long-ranging, thin filamentous and widely branching morphologies, multiple neurons are tightly inter-weaved, and partial volume effects, uneven illumination and noise inherent to light microscopy severely impede local disentangling as well as long-range tracing of individual neurons. These properties reflect a current key challenge in machine learning research, namely to effectively capture long-range dependencies in the data. While respective methodological research is buzzing, to date, methods are typically benchmarked on synthetic datasets. To address this gap, we release the FlyLight Instance Segmentation Benchmark (FISBe) dataset, the first publicly available multi-neuron light microscopy dataset with pixel-wise ground truth. Together with the data, we define a set of instance segmentation metrics for benchmarking that we designed to be meaningful with regard to downstream analyses. Lastly, we provide three baselines to kick off a competition that we envision to both advance the field of machine learning regarding methodology for capturing long-range data dependencies, and facilitate scientific discovery in basic neuroscience.
Dataset documentation:
We provide a detailed documentation of our dataset, following the Datasheet for Datasets questionnaire:
Our dataset originates from the FlyLight project, where the authors released a large image collection of nervous systems of ~74,000 flies, available for download under CC BY 4.0 license.
How to work with the image files
Each sample consists of a single 3d MCFO image of neurons of the fruit fly. For each image, we provide a pixel-wise instance segmentation for all separable neurons. Each sample is stored as a separate zarr file (“zarr is a file storage format for chunked, compressed, N-dimensional arrays based on an open-source specification.”). The image data (“raw”) and the segmentation (“gt_instances”) are stored as two arrays within a single zarr file. The segmentation mask for each neuron is stored in a separate channel. The order of dimensions is CZYX.
We recommend to work in a virtual environment, e.g., by using conda:
conda create -y -n flylight-env -c conda-forge python=3.9
conda activate flylight-env
How to open zarr files
1) Install the python zarr package:
pip install zarr
2) Open a zarr file with:
import zarr
raw = zarr.open(<path_to_zarr>, mode='r', path="volumes/raw")
seg = zarr.open(<path_to_zarr>, mode='r', path="volumes/gt_instances")

# optional:
import numpy as np
raw_np = np.array(raw)
Zarr arrays are read lazily on-demand. Many functions that expect numpy arrays also work with zarr arrays. Optionally, the arrays can also explicitly be converted to numpy arrays.
How to view zarr image files
We recommend to use napari to view the image data.
1) Install napari:
pip install "napari[all]"
2) Save the following Python script:
import zarr, sys, napari

raw = zarr.load(sys.argv[1], mode='r', path="volumes/raw")
gts = zarr.load(sys.argv[1], mode='r', path="volumes/gt_instances")

viewer = napari.Viewer(ndisplay=3)
for idx, gt in enumerate(gts):
  viewer.add_labels(
    gt, rendering='translucent', blending='additive', name=f'gt_{idx}')
viewer.add_image(raw[0], colormap="red", name='raw_r', blending='additive')
viewer.add_image(raw[1], colormap="green",  name='raw_g', blending='additive')
viewer.add_image(raw[2], colormap="blue",  name='raw_b', blending='additive')
napari.run()
3) Execute:
python <script_name.py> <path-to-file>/R9F03-20181030_62_B5.zarr
Metrics
| Metric | short description |
|---|---|
| S | Average of avF1 and C |
| avF1 | Average F1 Score |
| C | Average ground truth coverage |
| clDiceTP | Average true positive coverage |
| FS | Number of false splits |
| FM | Number of false merges |
| tp | Relative number of true positives |
(for a precise formal definition please see our paper)
Note
Following Metrics reloaded, a metric consists of three steps: localization, matching and computation. In the localization step some function is used to compute how well each pair of prediction and gt instances are co-localized. In the matching step a subset of these pairs is selected, resulting in a match of predictions to gt instances. In the last step, the computation step, the value of the metric is computed based on the quality of the previously computed subset of matched instances.
Aggregate benchmark score S
average of avF1 and C:
S = 0.5 * avF1 + 0.5 * C
Average F1 score avF1
- localization: clDice
- clDice measures how much of the centerline of a given gt instance is covered by a certain predicted instance and vice versa
- compute clDice for all pairs of predicted and gt instances
(dice = 2 * (precision * recall) / (precision + recall))
- matching: greedy
- sort all clDice scores in descending order
- match corresponding (pred, gt)-pair if neither has been assigned before (one-to-one matching)
- computation (compute value for metric)
- derive TP (true positives), FP (false positives), FN (false negatives)
- compute F1 for a range of thresholds th
- for each th in [0.1:0.9:0.1]:
- TP: all predicted instances that are assigned to a gt label with clDice > th
- FP: all unassigned predicted instances
- FN: all unassigned gt instances
- compute F1 = 2TP/(2TP + FP + FN) for each threshold, across all images.
- for each th in [0.1:0.9:0.1]:
- final avF1 score: average of all F1 scores
Average ground truth coverage C
- localization: clPrecision
- compute clPrecision scores for all pairs of predicted instances and gt instances
- matching: greedy
- sort all clDice scores in descending order
- match each predicted instance to the gt instance with the highest clPrecision score
- each gt instance can be covered by multiple predictions (one-to-many matching)
- computation
- average clRecall for all gt instances and the union of their matched predictions
(to avoid double-counting of pixels with overlapping predictions)
- average clRecall for all gt instances and the union of their matched predictions
Average clDice for TP (clDiceTP) and relative TP (tp)
- localization: clDice
- (re-use localization from avF1)
- matching: greedy
- (re-use matching from avF1)
- computation
- clDiceTP: average clDice for all matches above a threshold of 0.5
- tp: divide number of matches above a threshold of 0.5 by the total number of gt instances
- clDiceTP: average clDice for all matches above a threshold of 0.5
FS (false splits)
FS errors occur when one gt instance is covered by multiple predicted instances.
- localization: clRecall
- compute clRecall scores for all pairs of predicted instances and gt instances
- matching: greedy
- greedy many-to-many matching with adaptive algorithm to handle overlaps (see Alg. 1 in paper)
- computation
- count for each gt instance the additional number of assigned predicted instances apart from one correctly matched instance
FM (false merges)
FM errors occur when one predicted instance covers more than one gt instance
- localization: clRecall
- compute clRecall scores for all pairs of predicted instances and gt instances
- matching: greedy
- greedy many-to-many matching with adaptive algorithm to handle overlaps (see Alg. 1 in paper)
- computation
- count for each predicted instance the additional number of assigned gt instances apart from one correctly matched instance
Baseline
To showcase the FISBe dataset together with our selection of metrics, we provide evaluation results for three baseline methods, namely PatchPerPix (ppp), Flood Filling Networks (FFN) and a non-learnt application-specific color clustering from Duan et al.. For detailed information on the methods please see our paper.
Leaderboard
If you applied your own method to FISBe, please let us know! We will add you to the leaderboard.
Leaderboard combined test set (completely+partly labeled data)
(Evaluated on completely and partly labeled data, trained on completely or combined (+partly))
| Method | S | avF1 | C | clDiceTP | tp | FS | FM |
|---|---|---|---|---|---|---|---|
| PatchPerPix | 0.35 | 0.34 | 0.35 | 0.80 | 0.36 | 19 | 52 |
| Duan et al. | 0.30 | 0.27 | 0.33 | 0.77 | 0.37 | 45 | 29 |
| FFN+partly | 0.27 | 0.24 | 0.31 | 0.80 | 0.36 | 18 | 36 |
| FFN | 0.25 | 0.22 | 0.29 | 0.80 | 0.32 | 17 | 39 |
Leaderboard completely test set
(Evaluated on completely labeled data, trained on completely or combined (+partly))
| Method | S | avF1 | C | clDiceTP | tp | FS | FM |
|---|---|---|---|---|---|---|---|
| PatchPerPix | 0.34 | 0.29 | 0.40 | 0.81 | 0.45 | 3 | 4 |
| Duan et al. | 0.28 | 0.23 | 0.33 | 0.81 | 0.38 | 6 | 1 |
| FFN+partly | 0.19 | 0.10 | 0.29 | 0.80 | 0.34 | 2 | 2 |
| FFN | 0.18 | 0.11 | 0.26 | 0.77 | 0.31 | 2 | 2 |
License
The FlyLight Instance Segmentation Dataset (FISBe) is licensed under the Creative Commons Attribution 4.0 International (CC BY 4.0) license.

Citation
If you use FISBe in your research, please use the following BibTeX entry:
@misc{mais2024fisbe,
  title =        {FISBe: A real-world benchmark dataset for instance
                  segmentation of long-range thin filamentous structures},
  author =       {Lisa Mais and Peter Hirsch and Claire Managan and Ramya
                  Kandarpa and Josef Lorenz Rumberger and Annika Reinke and Lena
                  Maier-Hein and Gudrun Ihrke and Dagmar Kainmueller},
  year =         2024,
  eprint =       {2404.00130},
  archivePrefix ={arXiv},
  primaryClass = {cs.CV}
}
Acknowledgments
We thank Aljoscha Nern for providing unpublished MCFO images as well as Geoffrey W. Meissner and the entire FlyLight Project Team for valuable discussions. P.H., L.M. and D.K. were supported by the HHMI Janelia Visiting Scientist Program. This work was co-funded by Helmholtz Imaging.
Changelog
There have been no changes to the dataset so far. All future change will be listed on the changelog page.
Contributing
If you would like to contribute, have encountered any issues or have any suggestions, please open an issue in this GitHub repository.
All contributions are welcome!